InData HackersbyGustavo CandidoKolmogorov-Smirnov (KS)é uma métrica de perfomance em modelos de classificaçãoJan 12, 20241Jan 12, 20241
InLet’s DatabyLeon SolonBalanceamento de classes? Cuidado, você pode estar fazendo errado!Primeiramente, que emoção de ter um primeiro artigo “técnico” publicado no Let’s Data! Espero que seja o primeiro de muitos :)Sep 8, 20224Sep 8, 20224
InDataDrivenInvestorbyAndreas StöcklMarketing Data Science — Churn PredictionAn Example with Data from KaggleJun 13, 2022Jun 13, 2022
InTDS ArchivebyAudhi AprilliantOptimal Threshold for Imbalanced ClassificationHow to choose the optimal threshold using a ROC curve and Precision-Recall curveJan 1, 20216Jan 1, 20216
InTDS ArchivebyRebecca Vickery8 Metrics to Measure Classification Performance…explained in plain EnglishDec 7, 20211Dec 7, 20211
Inbio-data-blogbyVinícius RodriguesEntenda o que é AUC e ROC nos modelos de Machine LearningAs curvas AUC e ROC estão entre as métricas mais utilizadas para a avaliação de um modelo de Machine Learning.Oct 26, 20186Oct 26, 20186
João Vitor SaviettoMachine Learning: Métricas, Validação Cruzada, Bias e VariânciaA validação do modelo de machine learning é uma etapa de extrema importância em qualquer projeto de IA/Data Science.Sep 21, 2021Sep 21, 2021
InAnalytics VidhyabyShivam SoliyaCustomer Segmentation using k-prototypes algorithm in PythonCluster analysis with k-prototypes algorithm of Smartwatch survey data in python.Jul 2, 2021Jul 2, 2021
InThe StartupbyRashid Kazmi, Ph.D.Customer SegmentationStrategy development based on customer lifetime valueOct 14, 2020Oct 14, 2020
Adria Binte HabibElbow Method vs Silhouette Co-efficient in Determining the Number of ClustersIn this article, I am going to write about the optimal method for figuring out number of clusters in k-means clustering. K-means…Feb 20, 2021Feb 20, 2021
InTDS ArchivebyPracticus AIThe 5 Clustering Algorithms Data Scientists Need to KnowFeb 5, 201855Feb 5, 201855
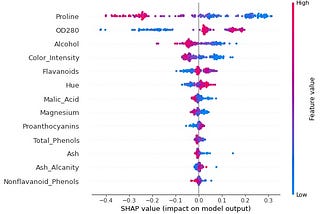
InTDS ArchivebyShuyang XiangHow to make clustering explainableIn this article, I will explain how to use SHAP values to have a better understanding of clusteringAug 31, 202110Aug 31, 202110
InTDS ArchivebyKonstantin RinkBest Practices for Visualizing Your Cluster ResultsProven techniques for cluster visualization and interpretationApr 21, 20225Apr 21, 20225
InTDS ArchivebyGireesh SundaramBeginners Guide to Clustering TechniquesThis is a modest explanation of three different clustering technique and how it is used on a dataset.Jul 27, 2020Jul 27, 2020
InBukalapak DatabyHafizh Adi PrasetyaSegmentation: Why, Which, HowWe all know that Data Science, in general, requires you to flex many different muscles; see other articles here that cover everything from…Feb 15, 20221Feb 15, 20221
InTDS ArchivebyBence KomarniczkyPyCaret for Classification: An Honest ReviewLow-code Machine Learning library for PythonFeb 3, 2022Feb 3, 2022
InTDS ArchivebyRashid Kazmi, Ph.D.Survival Analysis To Understand Customer RetentionIntroductionNov 13, 2019Nov 13, 2019
InCodeXbyBarış CengizEvaluating Classification Models, Confusion MatrixIn classification problems, accuracy of a model can be the main performance indicator in many cases. But there are some cases accuracy is…Apr 24, 2022Apr 24, 2022
InTDS ArchivebySoner YıldırımChurn Prediction with Machine LearningA step-by-step explanation of a machine learning project.Apr 13, 20201Apr 13, 20201